|
RL05 Products (Updated: 2015-04-07) Science Data Products GRACE Newsletter Mission Overview |
|
Switch Maneuver Of GRACE Satellites Since the trailing satellite (GRACE-2) has been flying "forward" with its K-Band antenna horn exposed to the impacting atomic oxygen, the project had planned to switch the positions of the leading and trailing satellites near the middle of the mission lifetime, in order to avoid any possible loss of thermal control over the horn which will affect the K-Band ranging signal. During this maneuver the trailing satellite will cross and take over the leading satellite and in order to eliminate any risk of collision, the relative motion characteristics were analyzed and an optimum time was chosen such that there will be a minimum guaranteed distance between them at the point of closest approach (CA). As a result of this analysis, December 10, 2005 was chosen to be the day for the CA event and consequently, the orbit thrust maneuver was performed on December 3, 2005. The following table contains highlights of the maneuver from the orbit configuration point of view. Highlights of Timeline During Switch Maneuver
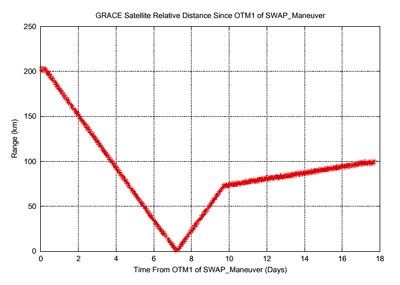
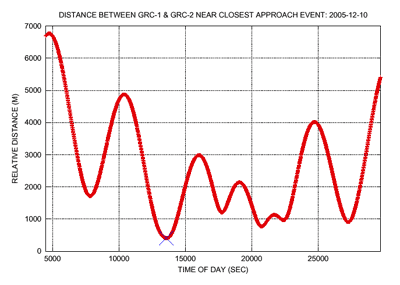
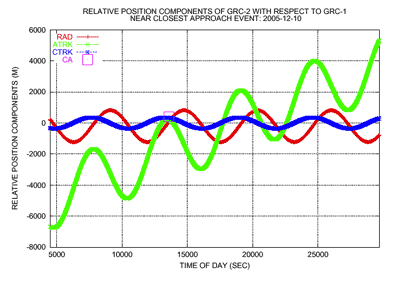
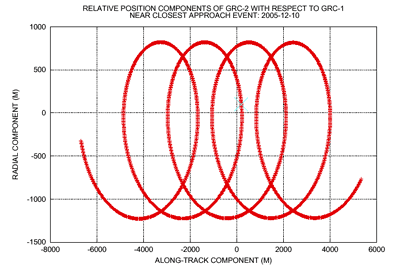
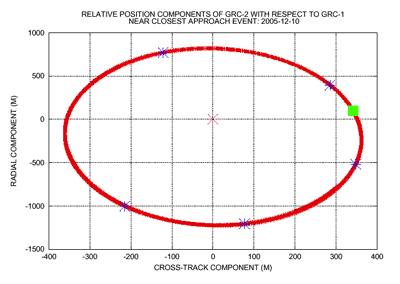
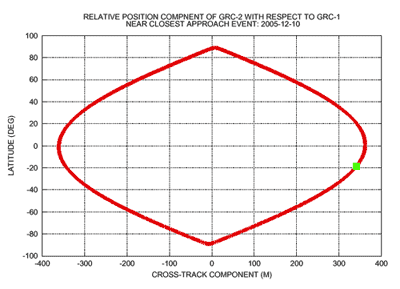
The above Table shows only events of interest from the orbit maneuver point of view but there were other important activities in terms of satellite attitude maneuver, thermal control, ground station monitoring (with additional support from PGN), etc., which are not shown here. The following graph shows the history of relative distance (range) between the two satellites, starting from the first orbit maneuver (OTM-1) to initiate the satellite switching operation. The following figure shows the scalar distance between the satellites around the CA event, which is marked by an X at about 13600 seconds, which is about 03:47 on December 10, 2005. The distance at CA was about 406 meters. The following figure shows the time history of the components of relative position of GRACE-2 in an orbit-fixed frame centered on GRACE-1 satellite. The square indicates the time of CA. For an observer looking at the motion of GRACE-2 from a position perpendicular the orbit and attached to the position of GRACE-1, the motion will appear as shown below. X is the CA point. For an observer looking in the direction of the velocity vector of GRACE-1 (but situated some distance behind it and moving with it), motion GRACE-2 will appear as shown in the following figure. The * marks are the positions of GRACE-2 when it crosses GRACE-1, going forward or backward (i.e. the along-track component is zero); the square indicates the position of CA point. As mentioned earlier, due to the relative orbit motion characteristics, the maximum cross-track orbit difference occurs near the equator and thus by performing the maneuver such that the CA event occurs near the equator, it is possible to be sure about a minimum distance at CA. The following figure shows the graph of the cross-track component of the relative position against latitude for a few orbits around the CA event, which is marked by the green square. It should be noted that the following shape of the graph holds for all orbits of GRACE satellites except for the variations in the maximum value of cross-track component at the equator (which depends on the difference in orbit inclinations and the nodes) and the slight tilting (either way) of the line joining the extreme latitude points. |


