|
Education Gravity Models Instruments Launch Preparation Launch Vehicle Links to Resources Other Images Spacecraft Video/Animation File |
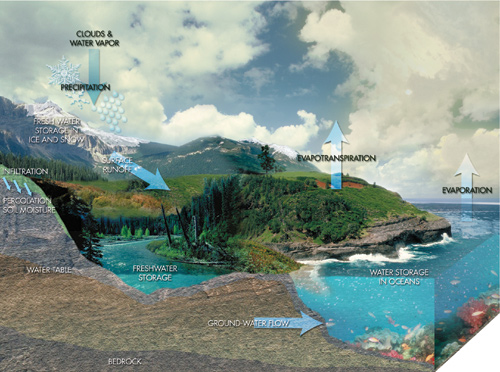
This diagram illustrates the hydrologic cycle and shows how water in solid, liquid and vapor forms, circulates over, under and above the surface of the Earth. Gravity fluctuations correlate with variations in the density of the land surface below.These illustrations can be used to track water movement. In effect, gravity becomes a mechanism to track water movement our eyes cannot see. GRACE data may lead to the identification of new sources of fresh watered in arid regions of the Earth. This image was produced at NASA Goddard Space Flight Center and is in the public domain. Please credit NASA Goddard Space Flight Center when using this image.
|
