| GRACE Newsletter No. 2 |
|
| August 15, 2003 | http://www.csr.utexas.edu/grace/ http://www.gfz-potsdam.de/grace |
Topics:
- Editorial
- Major events in Mission Operations since last Newsletter
- Current status of satellite and payload instruments
- Orbit summary
- Ground Segment and Data collection
- Highlights of Science Data Quality
- Outlook
The satellites have completed the commissioning phase and are transitioning to the calibration/validation phase. Completion of the commissioning phase was delayed by approximately twelve months due to several hardware and software anomalies. Following a thorough Post Launch Assessment Review, which was completed on April 25, 2003, it was concluded that the performance and operational objectives of the commissioning phase had been concluded and the mission was ready for the next phase.
The post launch assessment review confirmed the following previous assertions about the mission status:
-
The satellites and instruments are performing remarkably well, given the ambitious goals. They are utilizing cutting-edge technology to develop micron-level ranging accuracy and high-precision accelerometer measurements. The measurements involve all elements of the dual-satellite configuration.
The satellite operations center is also performing well, with over a 95% collection rate of data. In December of 2002, the GRACE team released its first image that graphically illustrated the satellites' measurement sensitivity to changes in the Earth's gravity.
As a part of the instrument and system accuracy assessment, a data set of 111 days has been used to determine a preliminary GRACE gravity model. This initial model shows a significant improvement over previous models for wavelengths of 500 to 15,000 km and, in this region, it has exceeded, by a factor of 10 to 50, the accuracy achieved using the gravity measurements collected over the past 30 years.
The mission is well on its way to satisfying minimum mission requirements and to surpassing it in some respects
With the Commissioning Phase completed, the mission has now transitioned into its Validation phase. The Validation Phase of the mission is scheduled to be a nine-month activity, with transition to the Operational Phase, now targeted for the end of the first quarter of 2004. The objectives of the Validation phase are to provide a definitive assessment of the instrument and satellite performance with regard to the data accuracy, to assess and improve the Level-1 and Level-2 data processing activities and to organize and conduct the requisite field campaigns to validate the scientific products derived using the Level-2 gravity products. Information from these activities will be used to improve the final data sets and provide the basis for the operational phase of the mission. Part of this activity has been initiated during the commissioning phase. Early gravity model solutions were determined to assess the on-orbit instrument performance and to define the changes in the Level-1 data processing approach needed to allow the mission to enter into the Validation phase.
All sensors and instruments are operating in the nominal science data collection mode, except for the inertial measurement unit (IMU), one of the ultra stable oscillators (USO) and one side of the instrument control unit (ICU) on GRACE-1, which are inoperative. A preliminary assessment of the early data indicates that the sensors are meeting the mission objectives. This Newsletter (No. 2) contains information on the current mission status, the GRACE orbital history, and the status of the satellite subsystems, the scientific instruments, the ground segment and the data processing activities.
| B. Tapley (GRACE PI) | Ch. Reigber (GRACE Co-PI) |
Mission Description
The GRACE mission was selected as the second mission under the NASA Earth System Science Pathfinder (ESSP) Program in May 1997. The GRACE mission will accurately map variations in the Earth's gravity field over its 5-year lifetime. The GRACE mission consists of two identical satellites flying about 220 kilometers apart in a near-polar orbit, at about 500 kilometers above the Earth.
Variations in the Earth gravity field affect the twin satellites at different times, leading to a change in the inter-satellite range. The Earth's gravity field is thus inferred from accurate measurements of the distance change between the two satellites using a K-Band microwave ranging system, along with non-gravitation force measurements from a precise accelerometer, and absolute position measurements from a GPS receiver. The system will provide scientists with an efficient and cost-effective way to map the Earth's gravity field with unprecedented accuracy. The results from this mission will yield crucial information about the distribution of mass within the Earth.
The gravity variations that GRACE will track include: changes due to surface and deep currents in the ocean; runoff and ground water storage on land masses; exchanges between ice sheets or glaciers and the oceans; and variations of mass within the Earth. Another goal of the mission is to create a better profile of the Earth's atmosphere. The results from GRACE will make a significant contribution to the goals of NASA's Earth Science Enterprise, Earth Observation System (EOS) and global climate change studies.
GRACE is a partnership between the National Aeronautics and Space Administration (NASA) in the United States and Deutsches Zentrum f�r Luft- und Raumfahrt (DLR) in Germany. Dr. Byron Tapley of The University of Texas Center for Space Research (UTCSR) is the Principal Investigator (PI), and Dr. Christoph Reigber of the GeoForschungsZentrum Potsdam (GFZ) is the Co-Principal Investigator (Co-PI). Project management and systems engineering activities are carried out by the Jet Propulsion Laboratory. Scientific products will be generated in a joint Science Data System managed by JPL, UTCSR and GFZ
Current Status
The commissioning phase was completed on May 14, 2003. The alignment of the K-Band Ranging system bore-sight relative to the star-sensors has been successfully determined from the analysis of the calibration maneuver data. Besides being used to improve the archived K-Band ranging data products, these alignments have also been uploaded to the s/c to enable more precise pointing between the twins. Prior to this maneuver, the center of mass of the spacecraft has been co-located at the proof-mass center to within approximately 30 microns, and the ability to track the evolution of the center of mass drift with fuel usage has been demonstrated. The s/c are routinely operating in dual-star camera mode, and interruptions due to the GPS receiver resets have dropped to approximately once every 5 to 7 days. All procedures for rapid response to in-flight anomalies are in place, and the tuning of most flight sub-systems is completed from the standpoint of housekeeping
2. Orbit Maneuver for Station Keeping
In order maintain the relative distance between the two satellites within the design range of 220km (with a variation of �50 km), an orbit maneuver was performed on GRACE-2 satellite on September 30, 2002 (DOY 273), when the separation distance was about 245 km. A single thrust for a duration of about 174 seconds changed the drift rate from about +2.2 km/day to about �1.1 km/day.
The orbit maneuvers so far were performed using single orbit thrusters with the aim of reducing the difference in the orbit inclinations of the two satellites. Figure 1, which shows the time history of the difference in the mean inclination of the two orbits, indicates that this objective has been met
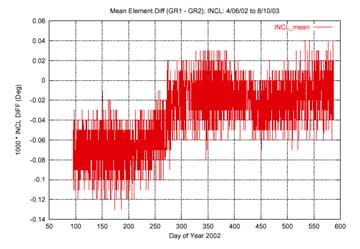
Figure 1 Difference between the Mean Inclinations of the orbits of GRACE-1 and 2
On January 30, 2003 another orbit maneuver was performed in order to reverse the rate of change of the relative distance, since the relative distance was approaching 170 km, the lower end of the limit. Since the difference in orbit inclinations has been almost eliminated, this maneuver attempted to reduce the difference in the eccentricity between the two orbits (see Figure 2) and hence both the orbit thrusters were used for this maneuver, applying the thrust at appropriate locations in the orbit to change the eccentricity.
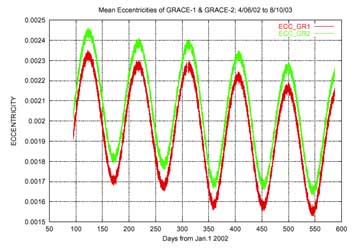
Figure 2 Time Variation of Mean Eccentricities of the GRACE-1 & 2 Orbits
IPU Software Upload
In order to improve the reliability of the IPU performance, and to enable dual star-camera head operation to improve data quality & to handle the Sun or Moon intrusions in the field of view of the Star Camera Assembly (SCA), a new software (version 148) upload to the Instrument Processing Unit (IPU) was planned. The upload was started on October 7 (DOY 280), 2002 for GRACE-2 and on October 8, 2002 for GRACE-1. The upload was designed as a two-part process, and after completion of the GRACE-2 upload, execution of SCA operations produced unexpected errors. Consequently, the remaining portion of the upload to GRACE-1 was aborted. After analyzing the flight diagnostic data, the error was remedied and the version 148 software upload to GRACE-2 was completed on January 10, 2003. The upload to GRACE-1 was completed by the end of January 2003. With this new software, both the SCA's can be operated simultaneously at high rate (1 Hz),which has already enabled an accurate K-Band bore sight calibration. With these uploads, the time between resets of the receiver has also increased to between 5 and 7 days, thus minimizing the disruption to operations.
AOCS Performance Improvements
The Attitude control system tuning activities directed towards the reduction of fuel consumption during inadvertent drops into safe modes have been completed. The attention will now turn to fine tuning the Science Modes, where pointing and thrusting performance will be optimized in conjunction with the Science Data System during the Validation Phase.
KBR Performance Improvement
In order to minimize the data quality degradation during periods of low-signal-to-noise ratio in the tracking, in-flight identification and mitigation of such conditions was implemented in the new IPU software. Furthermore, the KBR derived data product quality is expected to significantly improve after the completion of the KBR Calibration maneuver analysis.
Accelerometer Operational Improvements
With a combination of in-flight and ground response procedures, long data outages have been virtually eliminated for the accelerometer. The temperature set points of the Interface & Control Unit (ICU) are being managed to maximize its lifetime.
3. Satellite Subsystems Status
Overall, the satellite sub-systems are operating in their nominal configuration. Several of the sub-systems have undergone one or more fine-tunings, to incorporate the in-flight experiences over the past several months. The power systems are delivering adequate power for housekeeping and payload operations. The thermal control system remains robust. Temperature set points were adjusted to accommodate the effects of the changing Sun-orbit orientation.
4. 4. Orbit Summary Relative Distance
The orbits of both satellites are evolving naturally, except for the station keeping maneuvers performed on GRACE-2. The history of the relative distance between the two GRACE satellites is shown in Figure 3. It is notable that the episodic change in rates (of relative distance) seen since the orbit thrust maneuver on DOY 273 are all due to AOCS 'mode drops' to the Safe Modes. During such Safe Modes, the spacecraft yaw is only loosely controlled, so that the s/c may potentially fly sideways to the wind, thus considerably increasing the drag acting on the spacecraft. The rate changed from about �1.2 km/day to about +0.4 km/day on DOY 310 when GRACE-1 AOCS mode dropped to CMCPM.. On DOY 359, GRACE-2 stayed in coarse pointing mode for about half a day and that caused the rate of relative distance to change from about +0.3 km/day to about -2.1 km/day on DOY 359 when the relative distance was about 233 km. The evolution of the distance between such episodes is a function of the relative altitude difference at the end of such episodes, the relative mass differences between the spacecrafts, and any other orbital maneuvers.
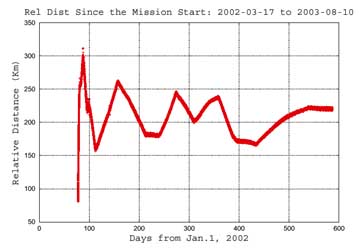
Figure 3 History of the Relative Distance between GRACE-1 and GRACE-2
Orbit Decay
The evolution of the mean semi-major axes of the orbits of GRACE-1 and GRACE-2 is shown in Figure 4. Since the two curves are not distinguishable when plotted, the values for GRACE-2 have been offset by 500 meters for clarity. Figure 5 shows the GRACE-1 mean altitude along with the solar flux for the same period of time.
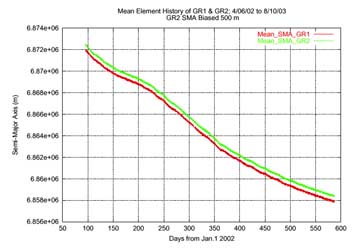
Figure 4 Evolution of Mean Semi-Major Axes of GRACE-1 and GRACE-2
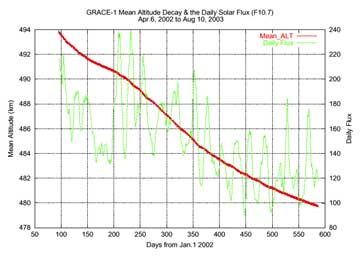
Figure 5 GRACE-1 Semi-major axis Decay and Solar Flux
A straight line fit to the mean semi-major axis values of GRACE-1 over the 492 days yields an average decay rate of about �30 meters/day. The overall decrease in mean SMA since the mission start is about 13.97 km. The average difference between the mean SMA of the two satellites depends on the rate of the separation distance.
5. Data Collection and pre-processing
At the end of the Commissioning Phase, a complete set of high quality Science Data has been collected. Complete science data refers to the measurements from the GPS on-board receivers, the Accelerometers, the Star Cameras, and the K-Band Ranging system from both satellites. For only 64 days since launch have complete science data not been available, when the Accelerometer data from Grace-1 was missing for much of June & July 2002 pending the investigation of its ICU failure. More than 99.7 % of the science and house-keeping data have been retrieved by the Science Data System. All except four days have been processed by the Level-1 data segment of the SDS, and delivered to the Level-2 processing centers of the SDS.
6. Highlights of Science Data Quality
All the science instruments are performing nominally. Typical data for the accelerometer and the KBR ranging system are shown in Figures 6-9. Figure 6 shows the accelerometer data along each of the three axes (in blue) compared to a mathematical model (in red), for a period of one day for each satellite. Some of the 'spikes' in the data are due to attitude thruster firings and others are due to anomalies such as 'twangs'. Overall data quality from the GRACE Superstar accelerometer has been good, and has already been exploited to within a few nanometer/s/s.
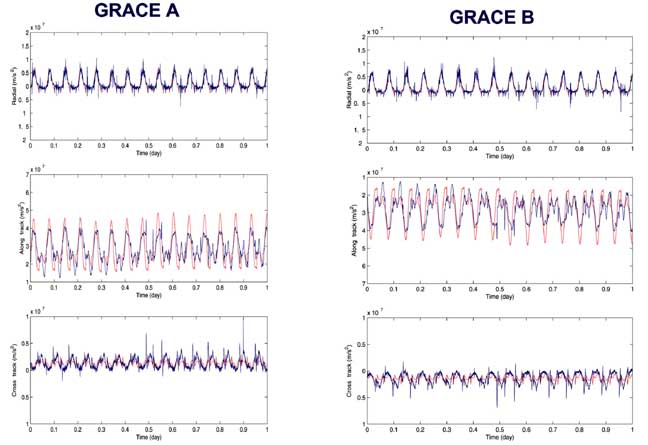
Figure 6 GRACE SuperStar Accelerometer Data
Figure 7 demonstrates the quality of the range data from the KBR system. The dual frequency (K and Ka band) ranging data from the two satellites are linearly combined to produce a quantity that is free of the time-of-flight or the range changes between the two sensors. Thus this residual quantity is reflective of the noise in tracking system or phase changes that are not desired range change signals; and these residuals are shown to have a standard deviation of a few microns.
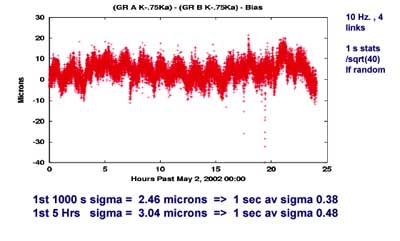
Figure 7 KBR Data Noise Level
Figure 8 shows the high frequency content and the sensitivity of the KBR range data to the Earth's topography along a portion of the groundtrack. After removing the large, long period variations from the full KBR signal (top of Figure 8), we can see the higher frequency range variations (middle of Figure 8). Sudden changes in the gravity due to the large topography changes over Antarctica and the Himalaya Mountains (bottom of Figure 8) produce clear signals at the level of 100 to 150 microns in the range residuals.
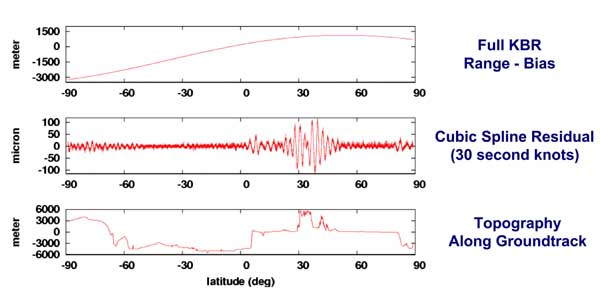
Figure 8 High Frequency Content of KBR Dual One-Way Range Measurement
In Figure 9, the high frequency component of the KBR range data (similar to the cubic spline residuals shown in the middle panel of Figure 8) are plotted as a function of geographical location. Regions of large topography changes (such as mountain ranges and plateaus) are clearly visible in this map as contours of 40 or more microns.
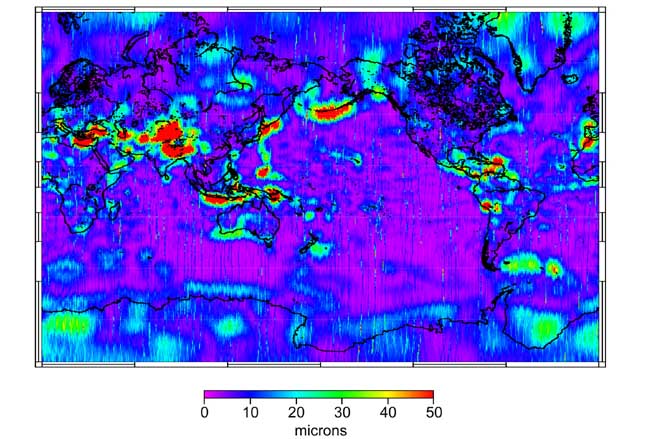
Figure 9 Topography features from KBR Dual One-Way Range Measurement
7. Outlook
The commissioning phase ended on May 14,2003, and the following flight operations have been completed:
- IPU software (Version 148) upload to both satellites
- Center of mass calibration
- Calibration of the KBR system
- A station keeping maneuver at the end of January 2003
- Upload of the quaternion to account for the misalignment of the Star Camera Assembly