|
GRACE Publications |
|
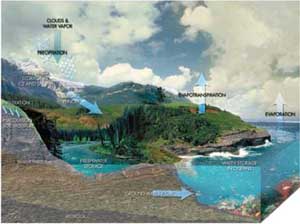
Tracking water movement on and beneath Earth's surface Perhaps the most interesting and least well-measured cause of fluctuations in the Earth’s gravitational field is movement of water over the surface of the Earth.The gravitational data collected by GRACE will be combined with data from other NASA satellites, aircraft and ground-based measurements to study the movement of liquid water over our home planet with a level of detail never before possible.Water moves in significant quantities throughout the Earth’s hydrologic cycle (see diagram), and at a rapid rate relative to other processes that redistribute mass over Earth’s surface. The gravitational variations observed by GRACE are primarily attributable to the seasonal and interannual movement of water through out the hydrologic cycle.This means that by combining measurements from GRACE with measurements taken on the ground, scientists will be able to improve their models of water exchange between the ocean and land surfaces - through rainfall, deep soil moisture, and runoff. This can be done from continental scales down to regional scales of a few hundred kilometers.
This diagram illustrates the hydrologic cycle and shows how water in solid, liquid and vapor forms, circulates over, under and above the surface of the Earth. Gravity fluctuations correlate with variations in the density of the land surface below.These illustrations can be used to track water movement. In effect, gravity becomes a mechanism to track water movement our eyes cannot see. GRACE data may lead to the identification of new sources of fresh water - which is of particular interest to populations located in arid regions of the Earth.
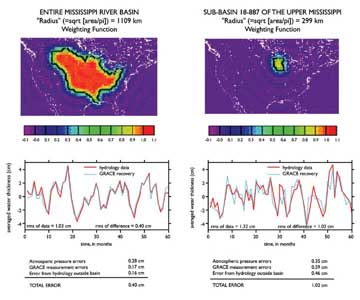
These figures illustrate the ability of GRACE to recover month-to-month variations in the water stored in individual river basins as compared to more traditional methods. The figure on the left looks at the entire Mississippi River basin while the figure on the right focuses on one sub-basin of the Mississippi. In each figure, the upper panel shows an outline of the river basin, along with a color contour of a mathematical averaging function that GRACE might use to estimate the water variations within that basin. The red line in the lower panel shows monthly variations in the actual water storage signal, in units of cm of water thickness; the blue line shows the values that GRACE would recover. In general, GRACE can recover water storage signals to about 1 cm or better for basins where the effective radius is 250-300 km or larger. The larger the basin, the more data from GRACE will improve the accuracy of these calculations. Hence it will do a better job looking at the entire Mississippi basin than it will do on individual subbasins. ( Image provided by John Wahr, University of Colorado.) |