|
Oceanographic Sciences - Surface Currents
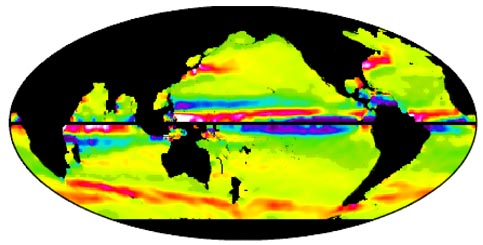
Ocean currents transport mass and heat between different regions of the Earth. Knowledge of these currents is therefore vitally important for Earth climate sciences. Some of the more familiar currents include the Gulf Stream off the eastern seaboard of the USA, the Kuroshio Current in the western Pacific off the coast of Japan; the Antarctic Circumpolar Current (ACC), which is the only current to travel through all major ocean basins; and the Equatorial Currents. Historically, knowledge of these currents has come from measurements from very limited number of current meters or drifter buoys (which measure the current directly at selected points in the oceans), or indirectly from the knowledge of slopes of the dynamic ocean topography. The dynamic ocean topography, and thus the currents, can be computed in two ways: 1) from measurements through the ocean depth of temperature and salinity, using instruments dropped from ships or from moored buoys, or 2) the difference between sea surface height measured by satellite altimeters (e.g. Topex/Poseidon) and a geoid model such as GGM02. The (image-A) below shows the east-west (zonal) currents derived using method 1) and the World Ocean Atlas of temperature and salinity profiles. This information has to be derived from only a small number of temperature and salinity measurements made each month, compared to the large number of altimetry measurements used in method 2). Additionally, this method has to make assumptions about sub-surface currents being zero at a certain depth - and this assumption is difficult to verify at all locations, as it would require either measurements all the way to the sea floor, or a direct measurement of the sub-surface current.
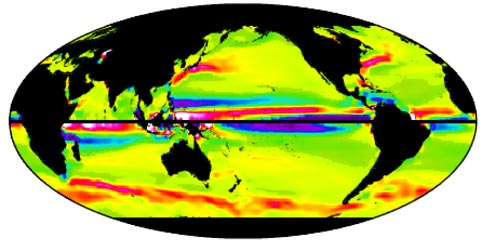
The (image-B) below shows the same currents derived using method 2), based on accurate measurements of both sea surface height from altimetry and geoid information from the GGM02 gravity field. Before GRACE, these determinations were limited by nearly 20-30 cm inaccuracies in the knowledge of the geoid. With geoid errors now reduced to near 1-cm at long-wavelengths with the GGM02 models, independent altimetric knowledge of the surface ocean currents has dramatically improved. This can be seen by the high similarity between altimetry/geoid derived zonal currents in (image-B) with those derived from temperature/salinity measurements (image-A).
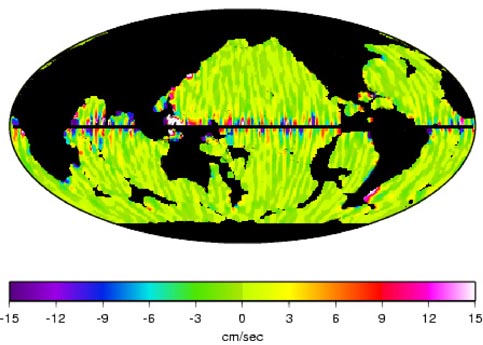
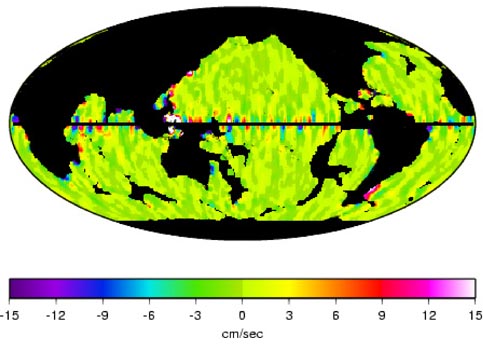
Some of the differences in the two maps are likely due to the lack of knowledge of sub-surface currents used to compute (image-A). For instance, notice that the ACC in (image-B) from altimetry/GGM02 is stronger than in (image-A). The ACC has a measurable current all the way to the ocean floor (~4 km deep), but few temperature/salinity profiles go this deep. This independent knowledge of absolute surface currents from altimetry and GGM02 can now be used in combination with the temperature and salintiy profiles to extract the currents as a function of depth. This in turn will improve our knowledge of mass and heat transported by these current systems. /topex/Improvements in the geoid models from previous GGM01 model to the current GGM02 model can be illustrated by comparing (image-C) and (image-D). These images show the differences between hydrographic and altimetry/geoid predictions of North-South surface currents. It is clear from this pair of images that the geoid improvement has removed several artifacts from the derived current velocities, most obviously in the equatorial Pacific, as the dramatic current reversals implied by altimetry/GGM01 along the equator were very unrealistic. However, note the patterns along the east coast of Asia and eastern South America that are consistent between the two geoids. These are also probably areas where the altimetry/GGM02 topography used in method 2) gives better knowledge of the surface currents than the hydrographic method 1).
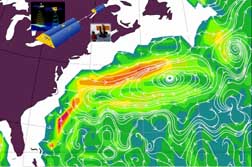
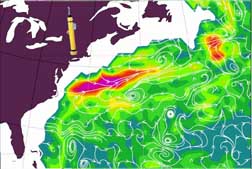
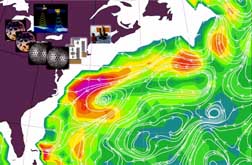
The following three pictures depict the ocean currents at 1000 meter depth (approximately 3,280 feet), and illustrate the impact of the GRACE gravity model on oceanography. Note the Gulf Stream extension, East and slightly South of Washington, DC, off the Eastern seaboard of the USA. The arrows point to the direction of flow of this current, and the colors depict its speed, with red being fastest and blue-green the slowest. Areas in white have no available data. As further described in the figure captions below, it is clear that the currents inferred using the GRACE geoid are dramatically more accurate than when using the previous best geoid model.
The Gulf Stream region of the North Atlantic is among the best studied in the world's oceans, with a significant quantity of high-quality data available on it as a result of shipborne instrument measurements. In other, less well-studied regions, the new gravity information provided by GRACE, together with satellite altimetry, will increase our knowledge of ocean circulation. |